The error
bars in the following images were drawn in Adobe Photoshop (R); they
were drawn to scale based upon a pixel-distance
calibration made using a graticule standard. Please note that
the accuracy
of the 1000X magnification error is questionable and is likely a slight
underestimate.
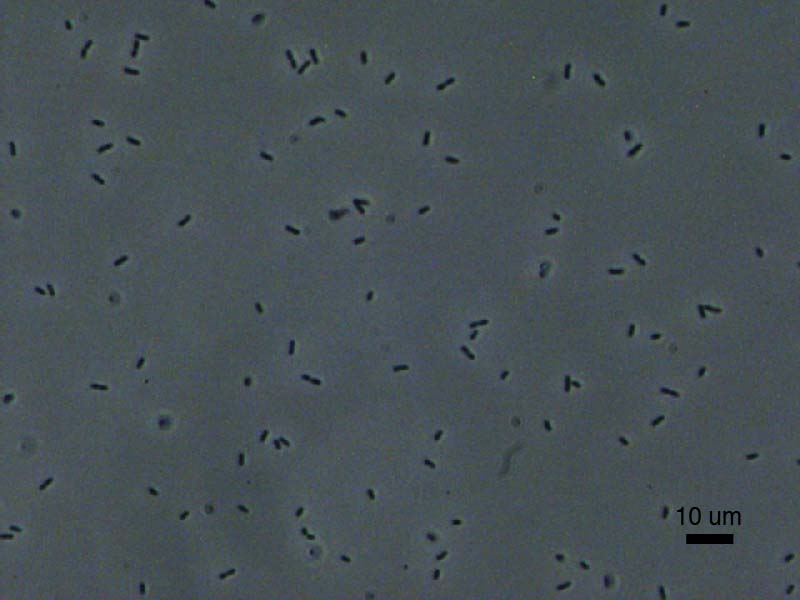
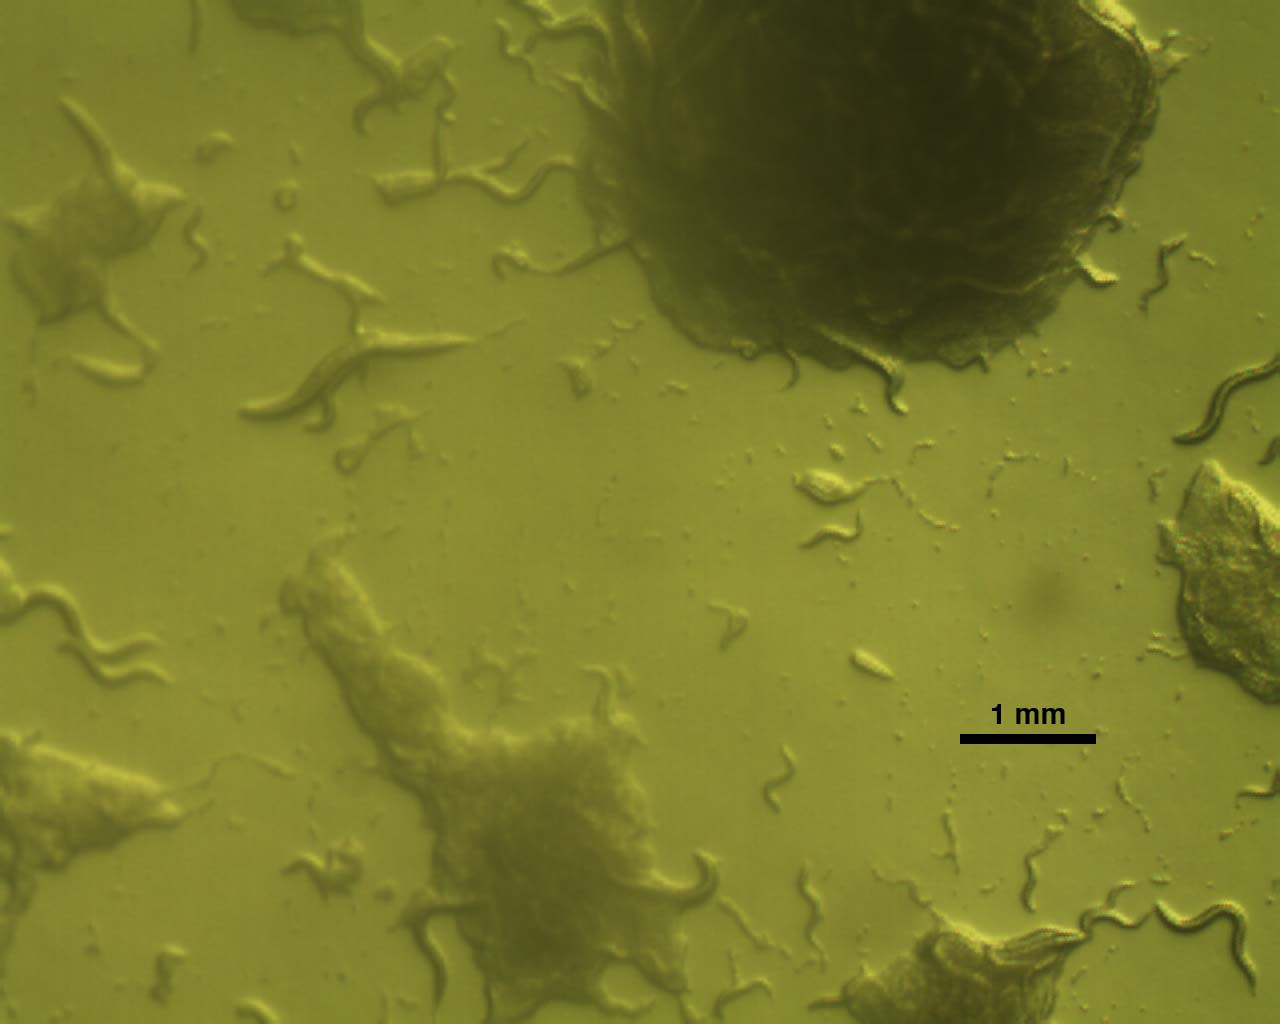
The first sequence of images below were taken to illustrate the
relative size of various organisms.
All images were collected using a Mitocam 1000 1.3 M camera in combination with
Olympus CX41 microscopes or, in the case of C. elegans, Olympus SZ61 stereoscopes.
E.
Coli at 400X Magnification
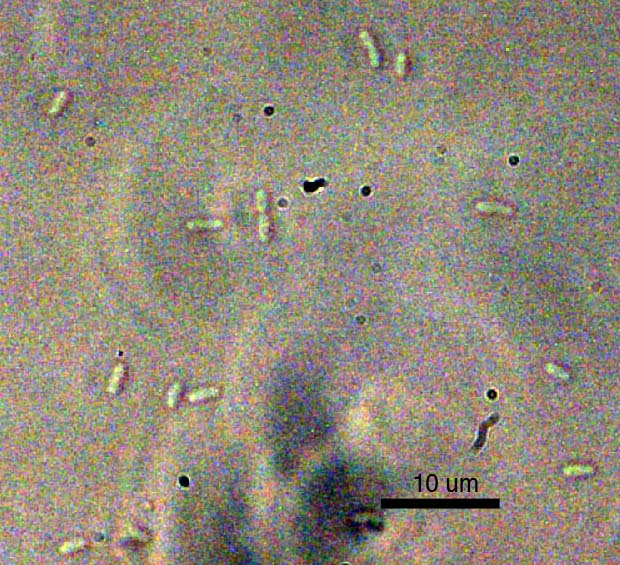
E.
Coli at 1000X Magnification
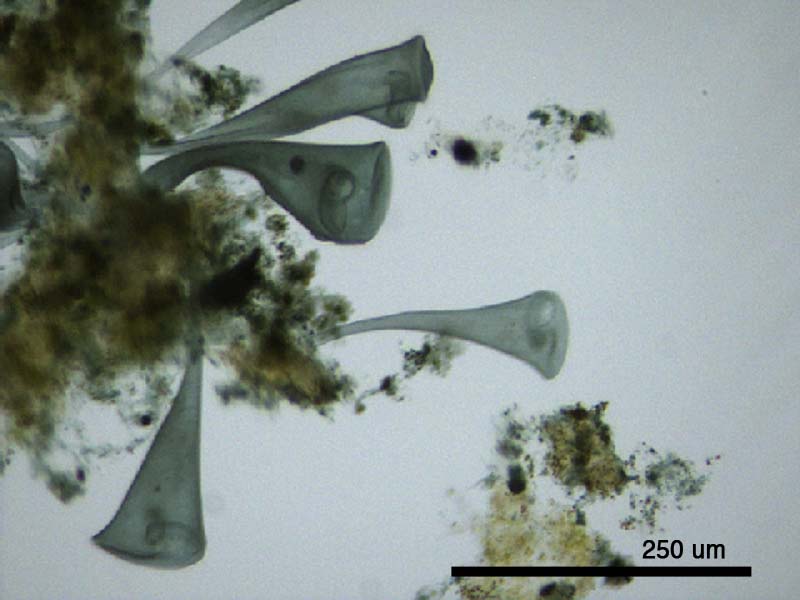
Stentor at
100X Magnification
Stentor is a trumpet shaped, single-celled protozoan. It is the largest single celled organism discovered to date.
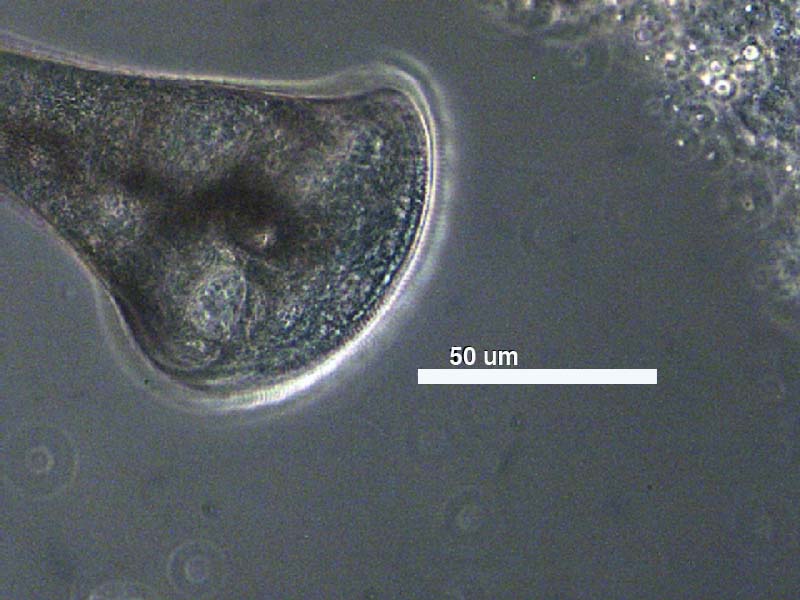
Stentor at
400X Magnification
Stentor at
400X Magnification
C. elegans
at 1.5X Magnification
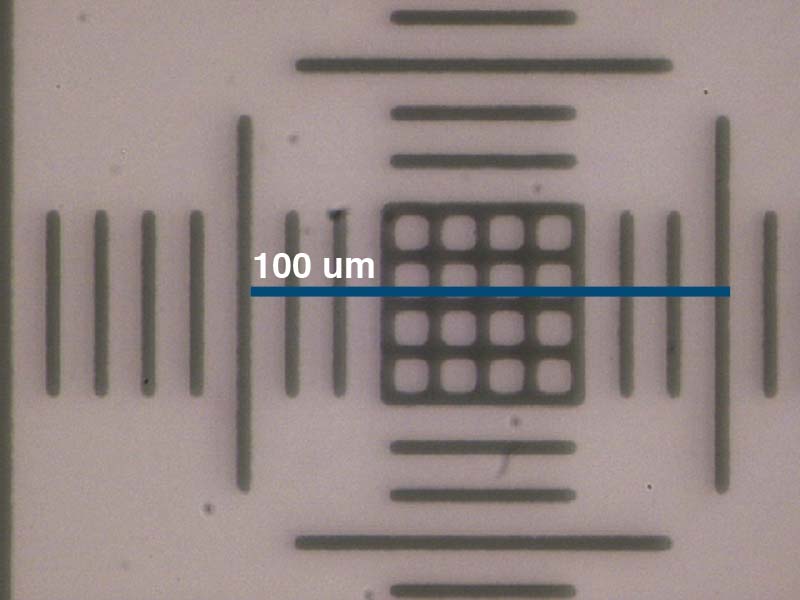
Below is a representative image of a graticule used to make
the distance-pixel calibrations necesary for the construction of
the scale bars used in the above images. A simple correlation
between known length and number of pixels using an image analysis
program (ImageJ, for example).
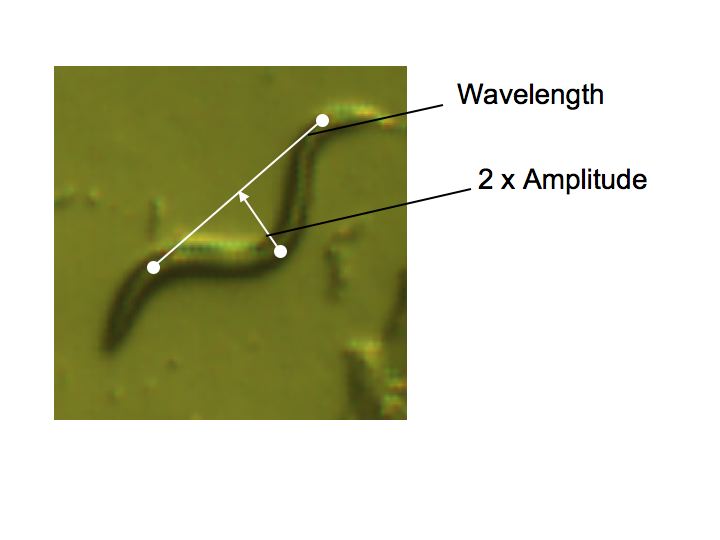
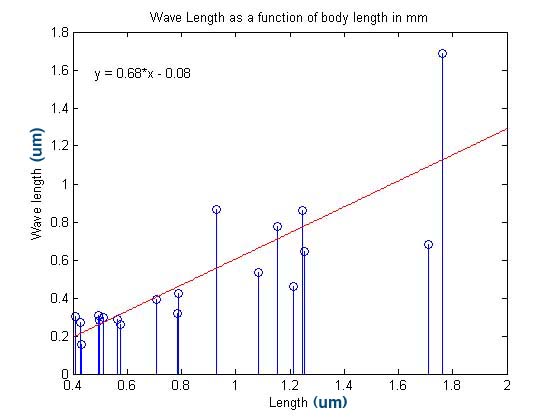
After
aquiring the above images, an anaysis was completed to determine if any
relationship exists between either wavelength or apmlitude of the
nematodes' swim pattern and their length.
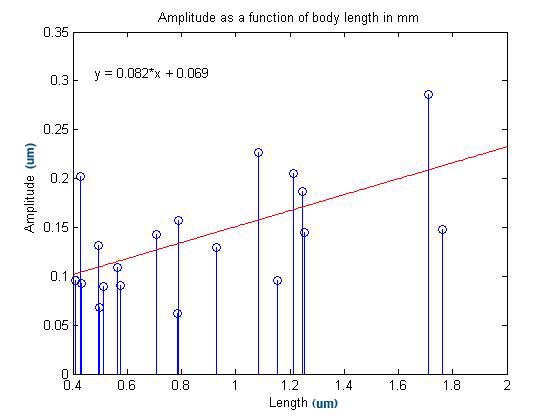
The data used in these plots was gathered using the image analysis
software in Matlab. The program used was fairly crude, but we
were nonetheless able to make two important observations based upon the
data it generated.
The
correlation coefficient for this regression is 0.5891, which indicates
that there is some correlation between amplitude and worm length.
This makes sense intuitively because one would expect longer
worms to be capable of forming larger arcs than smaller worms.
The
correlation coefficient for this regression was 0.8193, which is larger
than that calculated for the amplitude with worm length. This
correlation may be an indication of the mechanical properties of the
nematode worm and restrictions on motion. It would seem to
indicate that longer worms are either stiffer and less able to bend
than their smaller kin or somehow benefit from making wider turns along
their length during their motion.
The experiments
reported below were conducted to gain a familiarity
with the time scale of cellular events.
The above
video shows the initial stages in the development of a Lytechinus variegatusegg
following firtilization. The halo that can be seen surrounding
the central opaque region of the egg is the firtilization envelope,
which is a barrier impermeable to sperm and helps to protect the egg
from the deliterious event of polyspermy (described below). The
above image was constructed using ImageJ.
An image of a sea urchin used in this experiment, as viewed from the
mouth.
Source: http://155.37.3.143/old/fertilization/urchin.gif.
These sea urchins were obtained off the coast of Florida.
The fertilization protocol was as follows:
Inject a 1M KCl solution into a sea urchin's shell.
Distribute ~1 ml evenly into the urchin's three membrane
defined chambers. This is done using a syringe.
Inject the solution, at a ~90 degree angle to the shell's
axis of symmetry, evenly into three locations (corresponding to each of
the sea urchin's chambers) spaced by around 120 degrees.
After injecting the KCl, shake the sea urchin briefly
to mix the solution evenly. Wait until the sea urchin begins
to eject gametes from the side of the shell opposite the mouth.
Collect the gametes on a petri dish and immediately
determine whether or not they are eggs or sperm using a microscope.
If sperm, continue to collect it on the petri dish and keep
it free from saltwater. If eggs, place the shell inverted
into a beaker full of seawater and allow the eggs to fall to the bottom
of the beaker -- the shell should be partially submerged in the
water.
Acting quickly, dilute the sperm 1:1000 in seawater.
Also pipette some of the egg suspension (enough solution to
cover the bottom of your coverslip) onto a microscope slide.
Be careful not to overcrowd the slide with eggs -- there
should be around 1 to 3 eggs on average for every microscope viewing
window at 10X. Cover the solution with a microscope slide
that has small wedges of modeling clay at each of its four
corners just suspending it above the eggs to avoid crushing
them.
Add 10 to 100 ul of the dilute sperm solution to the
microscope slide with the eggs.
Observe the firtilization process under the 10X
objective using a microscope.
Take images of the sample at regular intervals so
that they may later be merged into a time-lapse video.
Note: It is important to adjust the concentration
of sperm such that polyspermy (multiple sperm firtilizing one egg) and
overcrowding of eggs is avoided. Both situations can alter
developmental behavior.
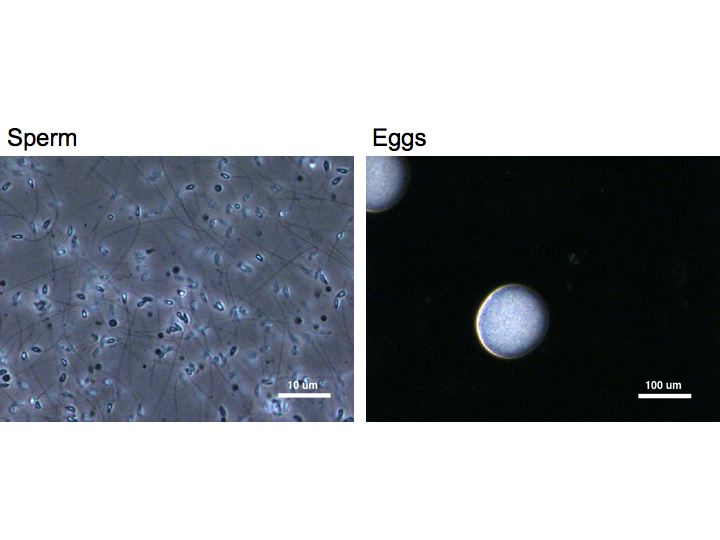
Below are shown some images of the gametes used in this
experiment:
During the experiment, the time at which each cell division occured was
recorded. The observed time spacing for each division are
listed
below:
First
division:
53 minutes
Second
division: 26
minutes
Third
division:
23 minutes
Fourth
Division: 25 minutes
The process of each division took approximately 6
minutes from initiation to completion.
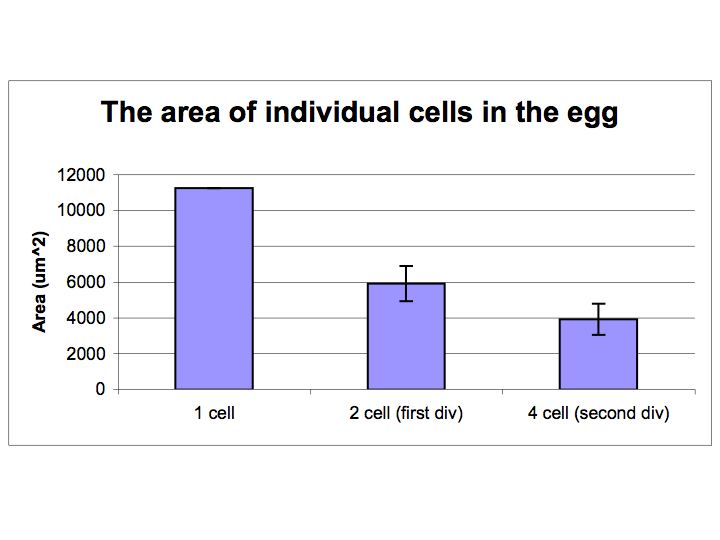
The crossectional are of the individual cells before and after each
cell division were measure using ImageJ. The crossectional area
was calculated directly from the number of pixels found to be contained
within each cell. Cell boundaries were defined arbitrarily
according to the best judgement of the observer. We have assumed
that
each division is symmetric. It appears that the total are is
approximately cut in half, as would be expected, after each division.
Measurements taken for the first two divisions of the cell are
given in the bar graph below.
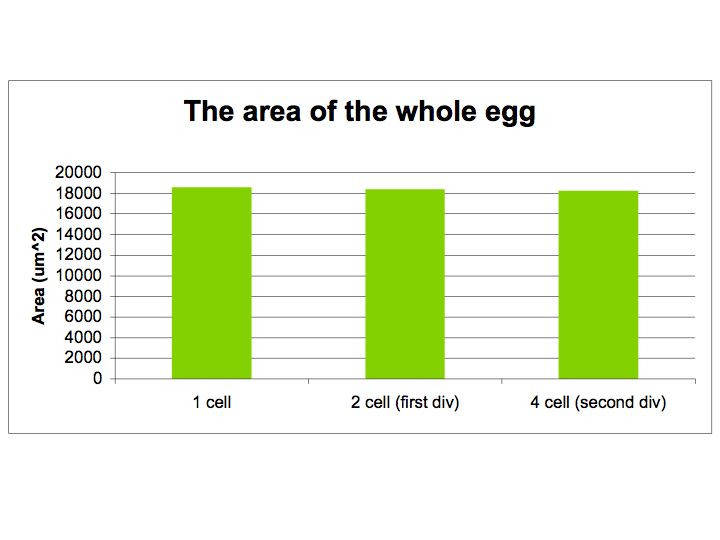
The crossectional area of the entire egg, as defined by the
envelope, was also measured before and after each cell
division. The crossectional area was calculated directly from the
number of
pixels found to be contained within the inner boundary of the
firtilization envelope. This boundary was
defined arbitrarily according to the best judgement of the observer.
Measurements taken for the first two divisions of
the
cell are given in the bar graph below. It was observed that the
size of the egg does not change substantially during the early
developmental stages of the sea urchin.